Archive for the ‘research’ Category

The physical demands of Lemons racing

Monday, October 12th, 2009

Fatigue – that’s a word you hear being thrown about a lot at endurance racing events. We know that as drivers do long stints behind the wheel, fatigue starts setting in and the lap times start to drop steadily. But the $64,000 question is how long can a driver stay out on track without compromising the performance of his/her car or the safety of the other competitors. People keep throwing around the statistic of F1 drivers having an average heart rate of 170 bpm for the 90 odd minute duration of the race. That data might be useful for a young fit F1 driver who spends the entire duration of the race on the ragged edge, but is not very relevant to the average Lemons driver who is generally older, considerably less fit, often drives longer stints and (speaking for myself) is generally well under the limit?

In order to learn more about the physical demands of Lemons racing, I decided to wear a heart rate monitor during my driving stints behind the wheel of our #23 Pink Pig E30 at the 24 Hours of Lemons race at Buttonwillow this past August. Our friends at Chasecam lent us a PDR100 video kit and copy of their Dashware software that allowed me to sync my heartrate to both the video stream and the in-car telemetry collected using my Race Technologies DL1 data logger. The following is a summary of what I learned with some things being as expected and some things decidedly unexpected.

Current Fitness Level
I’ll start by giving a quick baseline values for my current fitness levels. I have a resting heart rate of just under 50 bpm and I run between 10-20 miles a week which puts me in the above average range of physical fitness. Click here to see an example heart rate trace from my last long run (outdoors, 85 F, 8.5 miles in 84 min, avg heart rate of 164 bpm).

Additionally since Buttonwillow in August is brutally hot (temps of 110 F are quite common) I did hot weather training (outdoor 10k twice a week at 2 in the afternoon) for a couple of months to help prepare for the heat stress. The temperatures during the race ended up being about 100F and I did wear a Cool Shirt which I used intermittently for the first hour and then continuously after that.

Data summary
stint 1 raw
The graph above shows my heart rate during a 2 hour 50 minute recording window. My average heart rate during this entire period was 120 beats/minute with a maximum of 165 bpm. As you can see there are several distinct segments where my heart rate varied significantly from the average. By syncing the heart rate data to the video I was able to find that each segment points to a specific event during the race.

Specific instances
stint 1 start
Looking at the first 25 minutes of the data you can see that my heart rate initially hovers around the 90 bpm mark. At this time I was lined up in the pitlane and waiting for the cars to slowly get released onto the track. The small spike at the 4 minute mark happens exactly as I get out of the pits and onto the racing service. I should add that I had never driven a single lap of Buttonwillow before (mechanical issues on Friday) and was very nervous about going blind onto a new track. As I start doing the yellow flag laps you can see that my heart rate starts dropping again and stays that way for the next 7-8 minutes as I slowly learn my way around the track. The next spike you see is at the 12 minute mark and is shown in this short video below which has my heart rate in the top left corner.


As luck would have it the car right behind me was given the green flag which meant that I had zero warning of the race start. As the cars behind start passing me on the straight my heart rate starts rising from the low 90s and hits 129 bpm in the middle of turn 2.

stint 1 2nd half
The graph above shows the last 90 minutes of my stint. There is a gradual drop-off in my heart rate starting at about the 1:21 mark. This corresponds to a long full course yellow out on the track. The heart rate initially does not drop by much as I am staying close to car in front so that I can pass it at the next green flag, but as I drive further along the course I realize its a full course yellow and start relaxing which drop my heart rate to just over a 100. You can see another example of it in the video below which shows a yellow flag segment from my second stint on day 1.

The second dip you see towards the end of my day 1 stint happens when our car breaks down on the exit of turn 1 and I pull off the course and stop. While I’m initially quite agitated as I try to restart the car, I quickly realize that the car is dead and my heart rate starts dropping to the 100 bpm mark. About 5 minutes later the tow truck pulls up to the car and tows me back to the pits. Once I get there my heart rate once again starts rising and goes well past the 150 mark as I get out of the car to try and help fix the problem. It goes back down to the 140 mark as the problem is found and fixed but then rises to a peak of 165 as I am refueling the car (a 40 pound fuel can on your shoulder will do that).

As I went through the data, the most surprising fact for me was that the heart rate does not seem to have much correlation to the speed, g-force, laptime, etc… In fact it seems more psychological than it is physical. While there are some small changes over a lap, there are no significant bumps going through particular turns or even when passing individual cars. Instead the most pronounced changes in heart rate happen when you come up on a large group of cars and are unsure of how to pass them. The following video is a great example of this. Initially my heart rate is in the 115-120 bpm range as I go through the sweeper by myself. As I catch up to a group of five cars it rapidly rises and peaks at 144 bpm as I pass the last car. As soon as I pass them it starts dropping quickly and levels back down at the 120-125 bpm range.

For comparison here is a clean air lap where it drops as low as 97 bpm with a temporary spike at 131 bpm but spends the majority of the lap between 115 and 125 bpm

Summary
My stint in this case was for 2.5 hours in 100 degree weather and I could probably have driven for another hour. One thing to note is that I have plenty of experience driving on track (karting enduro, HPDE, Lemons) and can tell when my performance level goes down. If you are not familiar with driving on track and/or are driving at 10/10ths you will get mentally drained well before you get physically fatigued. If you dont take car to monitor your concentration you will start making more and more mistakes. The optimal stint length can and will vary dramatically even for the same person depending on their mental and physical state – I did a 4+ hour stint at Lemons Thunderhill 07 with no problems but when I drove a Spec Miata there I was wiped out in just 45 minutes.

In summary I can say that while Lemons is indeed quite strenuous, the mental aspect is more taxing than the physical. If you are used to good cardio workouts and can monitor your own concentration levels, it is possible to safely to do long stints. All this of course only applies to me and the way I drive – your mileage WILL vary and I make no statements about your driving abilities

Bonus video
And finally as bonus here is a 15 minute battle I had with the Itallion stallions Fiat X1/9. It starts off with them passing me on the run up to the hill and I then spend the next 15 minutes trying to get the position back. I’ve speeded up the sections where I am trying to catch up to them while the close quarters action is at regular speeds. Total run time is a little over 10 minutes. My favourite section is at the 6:20 mark where I pull alongside on the exit of the bus stop and we go side-by-side for 3 corners till I finally have to give up because they have the inside line over the hill. In case you are wondering they have modified the X1/9 to run motorcycle carbs which is why they were able to stay ahead on the straight. Plus this is within the first 10-12 laps on track so I’m still not very familiar with the track which I hope excuses the bad driving :-)

  • Share/Bookmark

Published

Tuesday, September 23rd, 2008

My first magazine article just came out in IEEE Multimedia:

ZoneTag’s Collaborative Tag Suggestions: What is This Person Doing in My Phone?
Mor Naaman and Rahul Nair
Yahoo!

A huge thanks to my co-author Mor for both the paper and the title of this blog post :-) .

  • Share/Bookmark

What is Mobile Spatial Interaction?

Sunday, July 15th, 2007

Helping organize the Mobile Spatial Interaction (MSI) workshop at CHI 2007 has made me very sensitive to the usage of the term MSI. Most people see Mobile and Spatial attached to Interaction and immediately start talking about location aware applications and services. However as someone who has spent the last few years working on location-aware applications, I have always felt that MSI and location-aware apps are two slightly different classes of research. As a result I’ve been spending some time thinking about how to define MSI as well as understanding how it differs (if it differs at all) from the current of location aware applications. My definition of location aware will of course be highly biased by projects like FireEagle, ZoneTag and Zurfer)

Location
I define location aware systems as systems that know the users absolute position. The accuracy of the location will of course change as will the source input (IP, Cell tower, GPS, user sumitted), used but by definition all location-aware systems can locate the user down to some arbitrary level of accuracy. The available accuracy may vary widely from country to city to zipcode to lat/long, and typically the best possible accuracy comes from GPS receiver which has an average error rate of about 30 feet.

MSI on the other hand requires not only the users physical location but also their spatial orientation (heading at a minimum but possibly including information like tilt, height, etc…). Typically MSI also requires a greater level of location accuracy – most spatially aware systems cannot do much with city level location and generally require at least GPS level location accuracy. In many ways you can consider the MSI grade location (and orientation) to be the logical conclusion of ever improving location aware technologies.

Interaction
To me the greatest difference between location aware and MSI applications is in terms of the interactions that they can enable. A location aware application has more of a “smart” interaction where the app tailors the content based on your location. ZoneTag is an excellent example of a location aware app that suggests tags based on your current location. To the user it appears to be a smart application that just knows what the user probably wants.

MSI interaction on the other hand can go much deeper than just smart apps. Sure it would be awesome to have a version of ZoneTag that showed the tags for the object you just took a picture of but that’s the obvious and (relatively) easy part. To me the real killer app for MSI is in enabling the creation of tangible* intuitive user interfaces. Interfaces that actually interact with their physical surroundings will not only have greater adoption (due to easy learnability) but peoples innate curiosity and playfulness will make the interaction more pleasurable (if you’ve ever seen a group of tenured professors act like children at a SmartSkin table you know what I mean :) ).

Magic
Ubicomp researchers have been trying to make these intuitive interfaces for years but have been hampered by the artificial nature of the sensing technology. With mobile phones becoming more powerful and increasingly including things like GPS, digital compasses, accelerometers, tilt sensors, etc… it isn’t going to be too long before every person is walking around with an MSI/Ubicomp enabling device in their pocket. If MSI researchers have their way people will no longer have to squint at tiny screens, explicit interfaces will disappear and users will directly query and interact with their real world environment. We still have a long way to go before we get there but projects like Air Messages, Point and Find, relateGateways, etc… are beginning to show how users can interact with the real world. They are opening a while new set of research questions about how people will react to such technology – I don’t know what the killer app will be but I’m pretty sure the interaction will be indistinguishable from magic.

* I am using the word tangible since even gestural MSI is situated in the physical environment.

[tags]MSI, Mobile spatial interaction, location-aware, lbs, research[/tags]

  • Share/Bookmark

Vannevar Bush Best Paper Award

Thursday, June 21st, 2007

Vannevar Bush Best Paper Award JCDL 2007
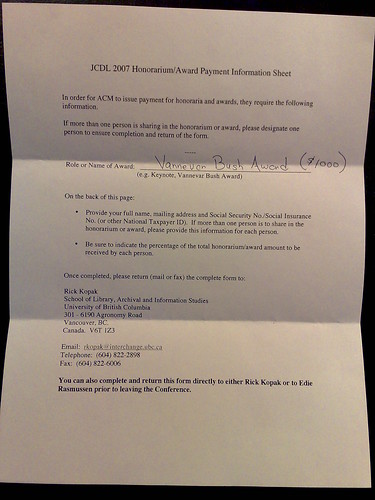
Our paper titled “World Explorer: Visualizing Aggregate Data from Unstructured Text in Geo-Referenced Collections” just won the Vannevar Bush Best Paper Award at JDCL 2007. A big thanks to my co-authors Shane Ahern, Mor Naaman and Jeannie Yang for all their help in both building the system and writing the paper – it was a great joint effort. You can read the paper, see the demo or look at my slides below.

Judith Bush has a report about my presentation as well.

  • Share/Bookmark

Talking at Ricoh: What’s in a place?

Thursday, June 7th, 2007

The following is the abstract of a talk I will be giving at the Ricoh California Research Center on Monday (11-Jun-07)

What’s in a place: Using geotagged images to explore the world
Can we automatically create an “attraction map” of the world from Flickr geotagged images and their associated tags? We performed an analysis of Flickr data and developed a visualization technique called Tag Maps to do exactly that. Using the analysis and the Tag Maps visualization, we created an exploration tool called World Explorer that allows one to, well, explore the world like never before.

The idea behind the data analysis is simple: by taking a photo, photographers essentially express their interest in a particular place, and implicitly “vote” in favor of that location. This gives us a set of highly representative tags associated with each map location. The World Explorer visualization is facilitated by placing these representative tags on a map (“a Tag Map”). We augment the Tag Map with photos that represent each tag at its specific location. Together, World Explorer effectively provides a sense of the important concepts and attractions embodied in each map area and zoom level, and allows users – tourists planning a trip, virtual world-discoverers or just some bored individuals – to explore the world via photos.

I’ll also give a brief demo and overview of Zurfer, a novel mobile phone context-aware software prototype that enables access to images on the go. It utilizes the channel metaphor to give users contextual access to media of interest according to key dimensions: spatial, social, and topical. Zurfer attempts to be playful and simple to use, yet provide powerful and comprehensive media access. A temporally-driven sorting scheme for media items allows quick and easy access to items of interest in any dimension. For novice users, and more complicated tasks, we extend the application incorporating keyword search to deliver the long tail of media and images.

[tags]talk, presentation, Ricoh, RII, CRC, TagMaps, Zurfer[/tags]

  • Share/Bookmark

TagMaps is live

Saturday, January 20th, 2007

TagMaps is the latest research project to come out of my group at YRB. It is a visualization technique that displays text on geographic maps. TagMaps can be used to communicate characteristics of location-based data in an easy-to-understand way. The World Explorer in particular uses TagMaps to display Flickr tags that denote the ‘important’ tags in any given geographical area. You can play with it at http://tagmaps.research.yahoo.com/worldexplorer.php

I built much of the back end for the system and am in charge of the data apis that we uses. If you want to play with this API for yourself I suggest you head over to either the Yahoo Developer Network or to the TagMaps Yahoo group.
For more info on TagMaps check out the post on the YRB blog.

  • Share/Bookmark

GPS mapping tools [Orig posted: 03/06/2005]

Saturday, January 20th, 2007

I have been spending a lot of time looking for various bits of software that will allow me to visually inspect the huge GPS dataset we have collected as part of the MMM project. Here is a quick listing of software that will hopefully save someone else some time :-)

1)USAPhotomaps: a freeware tool written by Doug Cox that will display GPS route and waypoint information over maps and aerial photos that it downloads from the USGS and the MS Terraserver. It also can display USGS points of interest along with TIGER streets information. A triumph of freeware with available source code though no licensing information is mentioned.
2)TopFusion: This is a shareware program that also plots GPS routes and waypoit info over different types of maps. Is a little bit more user friendly that USAPhotoMaps and also allows you to easily add and remove multiple datapoints sets for quick comparisons across datasets. It can also convert between different data formats. The demo version is almost fully functional while the full version is $40.
3)Google Maps: As you can see from my earlier posts I am a big fan of the Google Maps interface and its relative hacker friendlyness. Engadget had a wonderful article on how to add you own waypoints to google maps. Geoblogging.com also has some easily modified code to display GPS coordinates and image thumbnails on Google Maps
4)GPSVisualizer: This is very cool site that lets you upload GPS coordinates in a variety of formats and displays them as SVG, PNG and JPEG files.
5)Mapserver is the result of a NASA funded OSS project at the University of Minnesota to develop web apps that can display spatial information. While not a full fledged GIS tool it does support have a good amount of functionality including the display of GPS points. The fact that it is an internet app just makes it an attractive deployement option.
6)Mappr is a geobloggers like site that displays georeferenced Flickr images on a map.
7)The Geographic Names Information System (GNIS) is a USGS initiative to mark the locations of almost 2 million physical and cultural geographic features in the United States and its territories.
8) GPS Coordinate converter is a site that can covert between different coordinate formats and display a map of the area
9)GPX format: GPX or the GPS Exchange Format is an XML based format used to exchange GPS information. A full specification of the format can be found at TopoGrafix.com

UPDATE: I’d like to add some more tools to this page
10) TagMaps widget: This is a YRB project that allows you to make a flash map that displays tags using just a simple GeoRSS feed (or file). You can see a samples of what is possible here and here.
11) GeoRSS maker: This is a mashup that I wrote to allow you to quickly make a GeoRSS feed using the GeoNames database as well as the geocoded articles on Wikipedia. When you enter a search term and press the “Search” button, GeoRSS maker returns the top 5 results that match the users query. Once you have verified the location from the description and/or links, just hit the “Add (Item)” button to add the item to the GeoRSS displayed on the bottom of the page. Just keep on doing more searches and adding items till you have the required GeoRSS which you can copy and paste into a separate file. More details are available in this blog post.

  • Share/Bookmark

Heuristic Evaluation Checklist [Orig posted: 11/02/2005 10:26:55]

Saturday, January 20th, 2007

I was browsing through the STC Usability SIG when I found a wonderful heuristic evaluation checklist. I especially like the arrangement where it is broken up into
1. Visibility of System Status (29 points)
2. Match Between System and the Real World (24 points)
3. User Control and Freedom (23 points)
4. Consistency and Standards(51 points)
5. Help Users Recognize, Diagnose, and Recover From Errors (21 points)
6. Error Prevention (15 points)
7. Recognition Rather Than Recall (40 points)
8. Fexibility and Minimalist Design (16 points)
9. Aesthetic and Minimalist Design (12 points)
10. Help and Documentation (23 points)
11. Skills (22 points)
12. Pleasurable and Respectful Interaction with the User (17 points)
13. Privacy (3 points)

It’s very well written though I’m not sure if using a term like “Aesthetic and Minimalist Design” is a good choice for a corporate report-sounds a little too Tufte’sque ;-)

  • Share/Bookmark

Interview Tips [Orig Posted: 11/02/2005 10:11:55]

Saturday, January 20th, 2007

Cooper design has a couple of online “take home” style questions as part of its recruitment process. They are an interesting read and can serve as a good warm up for a prospective interview. The positions are
Interaction Designer (pdf)
Design Communication(pdf)
Interaction designer(pdf)

Chauncey Wilson, the moderator of STC Usability SIG has compiled and shared this list of interview questions with his community. Most ar3e pretty standard but some are really thought provoking (eg: A participant in a lab study has been struggling on the same task for a long time. What would you say to get them to move on to the next question?)

——————————————————————-
1. What 2-3 usability design books would you recommend to colleagues?
2. Why are you looking for a new position?
3. What do you like most/least about your current job?
4. What are some of the ethical issues that can arise in a usability/UI design position? Have you experienced any of these personally? What did you do to resolve the ethical issue?
5. Describe how you have marketed usability/Design in your current position? How would you market usability if you were the first usability/UI design person in a company?
6. Describe a project that didn’t go well for you in your current position and tell us what you might do differently?
7. What 2-3 usability evaluation methods are you most experienced with?
8. What usability/UI design methods would you like to know more about or are least experienced with?
9. Have you taught any courses or seminars in usability or UI design? What topics did you emphasize in the course?
10. What are the advantages and disadvantages of having a GUI or Web style guide? If you have worked on a style guide, describe your method for developing it.
11. How have you addressed issues of UI consistency across products in your current position? (if yes, please describe how you did and the success and failures that you had).
12. About how many usability tests have your run?
13. What courses or seminars have you taken on usability or design?
14. Have you been involved in gathering requirements in your current or past positions? How did you go about gathering requirements? What would you do differently?
15. Can you describe a specific design problem that you work on and some of the issues or problems that you had to solve?
16. What are some of the differences in designing for the Web versus a Windows (or other platform) GUI application?
17. What percent of time to you spend in evaluation versus design in your current position?
18. What role can QA play in improving the usability or UI design of a product?
19. If you were going to visit a beta customer and were asked to take an engineer along, how would you prep the engineer for the visit?
20. What have/can you do to make usability lab testing as realistic as possible?
21. How much experience do you have recruiting external customers for evaluation or design activities?
22. Could you describe how some usability/UI design activities would fit into the development process?
23. How do you define when a product is “usable enough”?
24. Here are a few screen shots from an application. What problems do you see here (usually give a person about 15 minutes and then go over the screen shot – don’t make it too hard).
25. How have you reported the results of a lab or field study to the appropriate parties?
26. What tools do you use to prototype screens, windows, or Web pages?
27. What do you like most about the usability field? Least?
28. How would you test the usability of online or paper documentation?
29. What do you know about the products that this company makes? (check to see if the person did any research before coming to the interview)
30. What steps have you taken to convince a recalcitrant developer to listen to your advice?
31. What are some design techniques for preventing errors rather than displaying some kind of error message?
32. How would you present the results of a usability test to a senior VP? A development group?
33. Can you give a few examples of cognitive principles that should influence design?
34. How do you get answers to usability or design questions that you have in the absence of another colleague in the area?
35. Pose some human factors problems to the person to get at some general problem solving capabilities. I once interviewed with a firm where they asked me to re-design the faucets for a bathtub. Not your typical UI design problem, but it brought up issues of control-display compatibility, feedback, errors, safety, efficiency, etc. Several of the good HF textbooks have a number of examples that could be adapted for this?
36. What are some general internationalization/localization problems and solutions?
37. What are some visual design principles that you would try to follow when designing Web pages or windows? (I’m thinking about things like balance, symmetry, consistency, clutter, minimalism, etc. – there are a lot of things that would be OK here).
38. How do you decide what tasks should be part of a usability test? (I’m looking for things like – most frequent tasks, focus on a new critical feature, low-use, but extremely critical task that is catastrophic if done incorrectly, again there are a number of answers).
39. You are going to work at a company where everyone says that “we have a really distinct culture here.” How would you go about figuring out what that statement means and how it will affect your usability/design work? How did you find out about the culture at your current company?
40. Describe your worst experience as a [fill in current position]. How did you deal with it?
41. How do you analyze qualitative field data in a way that is useful for informing developers how to make design changes?
42. A participant in a lab study has been struggling on the same task for a long time. What would you say to get them to move on to the next question?
43. Show the person a 15 minute segment of a usability test and ask him/her to list the problems that they see during the segment. (Make sure that you have permission to sue that segment from the participant). Review the tape with the participant.
44. Ask the person to do the Heuristic Review at the end of Jakob Nielsen’s Usability Engineering book. Jakob has an answer list and this gets at a large number of design issues.
45. You have time to interview or test 5 users. What criteria would you use to choose the 5 people?
46. What are the advantages and disadvantages of Contextual Inquiry (only ask if they have listed this on their resume)?
47. How have/would you conduct a competitive analysis of two applications or web sites (assuming that there are no legal prohibitions)?
48. The lack of good requirements is often cited as the major flaw in producing useful products on time and within budget? What methods would you use to gather requirements?
49. Describe how the physical environment can have an impact on the design of a GUI application.
50. Here is a list of user attributes. Tell me how these attributes would affect design (for example, 10 percent of users are colorblind, the users are elderly, the users are disabled).
51. What are some general guidelines for making applications or Web pages accessible to users with visual, hearing, or motor disabilities?
52. Given that a usability person often delivers “bad news” how do you (or your management) keep good relations with the group that you are delivering the bad news to?

  • Share/Bookmark