Posts Tagged ‘analysis’

The physical demands of Lemons racing

Monday, October 12th, 2009

Fatigue – that’s a word you hear being thrown about a lot at endurance racing events. We know that as drivers do long stints behind the wheel, fatigue starts setting in and the lap times start to drop steadily. But the $64,000 question is how long can a driver stay out on track without compromising the performance of his/her car or the safety of the other competitors. People keep throwing around the statistic of F1 drivers having an average heart rate of 170 bpm for the 90 odd minute duration of the race. That data might be useful for a young fit F1 driver who spends the entire duration of the race on the ragged edge, but is not very relevant to the average Lemons driver who is generally older, considerably less fit, often drives longer stints and (speaking for myself) is generally well under the limit?

In order to learn more about the physical demands of Lemons racing, I decided to wear a heart rate monitor during my driving stints behind the wheel of our #23 Pink Pig E30 at the 24 Hours of Lemons race at Buttonwillow this past August. Our friends at Chasecam lent us a PDR100 video kit and copy of their Dashware software that allowed me to sync my heartrate to both the video stream and the in-car telemetry collected using my Race Technologies DL1 data logger. The following is a summary of what I learned with some things being as expected and some things decidedly unexpected.

Current Fitness Level
I’ll start by giving a quick baseline values for my current fitness levels. I have a resting heart rate of just under 50 bpm and I run between 10-20 miles a week which puts me in the above average range of physical fitness. Click here to see an example heart rate trace from my last long run (outdoors, 85 F, 8.5 miles in 84 min, avg heart rate of 164 bpm).

Additionally since Buttonwillow in August is brutally hot (temps of 110 F are quite common) I did hot weather training (outdoor 10k twice a week at 2 in the afternoon) for a couple of months to help prepare for the heat stress. The temperatures during the race ended up being about 100F and I did wear a Cool Shirt which I used intermittently for the first hour and then continuously after that.

Data summary
stint 1 raw
The graph above shows my heart rate during a 2 hour 50 minute recording window. My average heart rate during this entire period was 120 beats/minute with a maximum of 165 bpm. As you can see there are several distinct segments where my heart rate varied significantly from the average. By syncing the heart rate data to the video I was able to find that each segment points to a specific event during the race.

Specific instances
stint 1 start
Looking at the first 25 minutes of the data you can see that my heart rate initially hovers around the 90 bpm mark. At this time I was lined up in the pitlane and waiting for the cars to slowly get released onto the track. The small spike at the 4 minute mark happens exactly as I get out of the pits and onto the racing service. I should add that I had never driven a single lap of Buttonwillow before (mechanical issues on Friday) and was very nervous about going blind onto a new track. As I start doing the yellow flag laps you can see that my heart rate starts dropping again and stays that way for the next 7-8 minutes as I slowly learn my way around the track. The next spike you see is at the 12 minute mark and is shown in this short video below which has my heart rate in the top left corner.


As luck would have it the car right behind me was given the green flag which meant that I had zero warning of the race start. As the cars behind start passing me on the straight my heart rate starts rising from the low 90s and hits 129 bpm in the middle of turn 2.

stint 1 2nd half
The graph above shows the last 90 minutes of my stint. There is a gradual drop-off in my heart rate starting at about the 1:21 mark. This corresponds to a long full course yellow out on the track. The heart rate initially does not drop by much as I am staying close to car in front so that I can pass it at the next green flag, but as I drive further along the course I realize its a full course yellow and start relaxing which drop my heart rate to just over a 100. You can see another example of it in the video below which shows a yellow flag segment from my second stint on day 1.

The second dip you see towards the end of my day 1 stint happens when our car breaks down on the exit of turn 1 and I pull off the course and stop. While I’m initially quite agitated as I try to restart the car, I quickly realize that the car is dead and my heart rate starts dropping to the 100 bpm mark. About 5 minutes later the tow truck pulls up to the car and tows me back to the pits. Once I get there my heart rate once again starts rising and goes well past the 150 mark as I get out of the car to try and help fix the problem. It goes back down to the 140 mark as the problem is found and fixed but then rises to a peak of 165 as I am refueling the car (a 40 pound fuel can on your shoulder will do that).

As I went through the data, the most surprising fact for me was that the heart rate does not seem to have much correlation to the speed, g-force, laptime, etc… In fact it seems more psychological than it is physical. While there are some small changes over a lap, there are no significant bumps going through particular turns or even when passing individual cars. Instead the most pronounced changes in heart rate happen when you come up on a large group of cars and are unsure of how to pass them. The following video is a great example of this. Initially my heart rate is in the 115-120 bpm range as I go through the sweeper by myself. As I catch up to a group of five cars it rapidly rises and peaks at 144 bpm as I pass the last car. As soon as I pass them it starts dropping quickly and levels back down at the 120-125 bpm range.

For comparison here is a clean air lap where it drops as low as 97 bpm with a temporary spike at 131 bpm but spends the majority of the lap between 115 and 125 bpm

Summary
My stint in this case was for 2.5 hours in 100 degree weather and I could probably have driven for another hour. One thing to note is that I have plenty of experience driving on track (karting enduro, HPDE, Lemons) and can tell when my performance level goes down. If you are not familiar with driving on track and/or are driving at 10/10ths you will get mentally drained well before you get physically fatigued. If you dont take car to monitor your concentration you will start making more and more mistakes. The optimal stint length can and will vary dramatically even for the same person depending on their mental and physical state – I did a 4+ hour stint at Lemons Thunderhill 07 with no problems but when I drove a Spec Miata there I was wiped out in just 45 minutes.

In summary I can say that while Lemons is indeed quite strenuous, the mental aspect is more taxing than the physical. If you are used to good cardio workouts and can monitor your own concentration levels, it is possible to safely to do long stints. All this of course only applies to me and the way I drive – your mileage WILL vary and I make no statements about your driving abilities

Bonus video
And finally as bonus here is a 15 minute battle I had with the Itallion stallions Fiat X1/9. It starts off with them passing me on the run up to the hill and I then spend the next 15 minutes trying to get the position back. I’ve speeded up the sections where I am trying to catch up to them while the close quarters action is at regular speeds. Total run time is a little over 10 minutes. My favourite section is at the 6:20 mark where I pull alongside on the exit of the bus stop and we go side-by-side for 3 corners till I finally have to give up because they have the inside line over the hill. In case you are wondering they have modified the X1/9 to run motorcycle carbs which is why they were able to stay ahead on the straight. Plus this is within the first 10-12 laps on track so I’m still not very familiar with the track which I hope excuses the bad driving :-)

  • Share/Bookmark

Spinning out at 95 mph

Friday, May 18th, 2007

Reno-Fernley course map

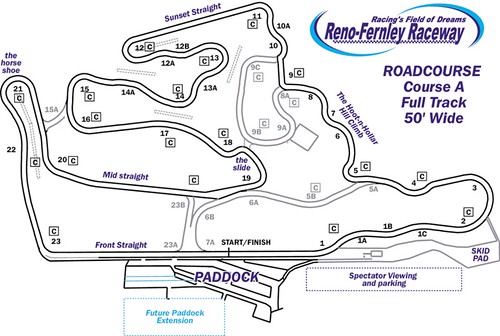
I was at the NCRC trackday at Reno-Fernley Raceway last weekend when I got some first hand experience of what happens in a high speed spin. I was coming down the front straight at well over 100 mph and slowed slightly to take the esses that make up turn 1. Now on the track map they may look like fairly severe turns but in actual fact you just lift a little bit to settle the car at the end of the straight before flooring it though S bends. On this particular lap I came in a little hotter than on my previous runs and just after i made it though turn 1 (but before 1A) the back end came around and I flew off the track at 95 mph.

People have asked me if my life flashed before my eyes but in reality the only thought that went through my head was “Please don’t flip!” :-) . The car was surrounded by a massive dust cloud which meant that I had zero visibility – I had the sensation of spinning and slowing down but had no clue as to which direction I was heading. As is standard practice during a spin I “put both feet in” (hit the clutch and brake) to ensure that the car has a predictable trajectory so that other drivers can avoid it. It probably took about 30 sec to a minute for the dust to settle but it felt like an eternity as I had no idea where on track I was or what the condition of the car was. Once the dust settled I found that I was in the sand/gravel trap about 50-60 feet from the left edge of the track and having done at least one 360, pointing in the correct direction. I started up the engine but since I couldn’t actually see much of the road in front of me I backed the car up about 10 feet. Moving the car turned out to be an excellent idea because the dried grass under the engine bay had caught fire and when I moved I could see that the spot I had stopped in was actually burning (maybe 4-6 inches on flame). I then waited for a couple of the cars to pass before slowly driving through the gravel trap and rejoining the circuit. The car initially felt fine but as soon as I took a right turn I found that the steering was pulling to the left. While I initially feared suspension damage, by the time I got to the pits I was pretty sure that it was a flat in my left front tyre.

Examining the wheel in the pits showed that the flat was due to the tyre popping off its bead rather than an actual puncture. I borrowed a jack and pulled off the tyre before inflating it and reseating the bead. Luckily the wheel had no damage and the tyre held air with no leaks. I also checked for suspension damage but thankfully everything was solid. Now that the my greatest fear was passed, I examined the rest of the car for damage and amazingly the only other issues were a broken mirror on the drivers side and some minor paint chipping on the drivers door. The car itself was absolutely filthy with a thick layer of dust coating every square inch of the interior and exterior. I knew that going into the gravel trap would be dusty but never expected it to be this bad – my passenger commented that it felt like a dump truck had poured a load of dirt into the cabin. I drove into local car wash during the lunch break and washed the exterior of the car before spending a small fortune on vacuuming the dirt out of the interior. In about 2 hours time the car was most back to normal and looked like merely a dirty car rather an absolute write-off.

12052007591

Never lift!!!

Result of the spin

Post Mortem
Since this was my first track day with a DL1 data logger, I actually had detailed logs to help me diagnose what exactly went wrong in the corner. The first diagram shows the line I took through turn 1 while the second is a graph showing the speed and longitudinal G force plotted against distance. The red line is the lap I went off on and the black line is data from my previous flying lap. The first thing I noticed that my speed down the front straight was significantly higher than on that lap (114 mph Vs 107 mph). This meant that when I lifted to set the car up for turn 1 it took longer to get to the right speed and I ended up going into the corner a bit too wide (figure 1). As a result of this the car got a little loose through the turn and I instinctively lifted of the throttle just a tiny bit (figure 2). This created a classic case of lift-off oversteer where the weight transfered to the front wheels causing the rear to lose traction and come around. I have experimented with lift-off oversteer before and even use it at autocross to rotate the car but this was the first (and hopefully the last) time this has happened to me at such a high speed. It was a pretty scary experience and happened so fast that I had absolutely no chance of catching it – all I could do was hold on and hope for the best.

dl1 map trace

dl1 xy

In the end I was extremely lucky to walk away from a near triple digit spin with nothing more than a broken side mirror and a very dirty car. Having the DL1 was extremely useful in diagnosing the issue (especially since I don’t recall lifting but the data doesn’t lie) and gave me more confidence about going back onto the track. The next day I was back on the track and while I was initially a bit gun shy of turn 1, by the end of the day I was taking it at regular speed. All in all it was a very educational experience and reinforced the need to follow the mid-engine car drivers mantra – “Don’t lift” :-) .

Update: I’ve posted this as an EliseTalk thread that is getting some interesting feedback and ‘confessions’ :-D

[tags]trackday, Reno-fernley, oversteer, spin, 360, DL1[/tags]

  • Share/Bookmark